For this year’s US Open, IBM has deployed advanced technology on the tennis field to collect the data to be analyzed and visualized. With the U.S. Tennis Association, IBM is providing public access to its PointStream technology in the form of a real-time data visualisation, which offers a special insight into every match. Each point is individually visualized in the application to offer an interactive representation of match data that updates in real time.
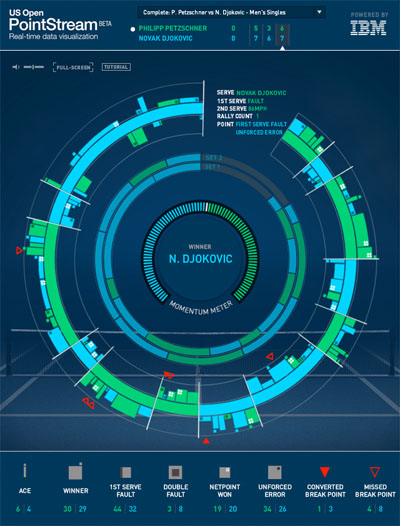
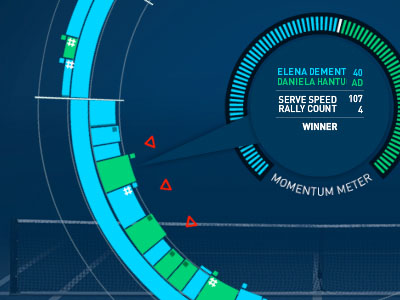
Expanding areas of the visualiser under the mouse allows them to be viewed in more detail. Each match is split into sets (concentric circles), games (collections of line segments) and points (individual segments). Players are represented by different colours, with each point segment taking the winning player’s colour. The length of each segment is representative of the length of the rally for that point, and serve speed is represented by the height of the segment.
A Key along the bottom of the visualiser doubles as a filtering option. Each representation can be clicked on to highlight the areas of the visualisation that contain those events. This allows a user to instantly focus on individual aspects of a game, such as the progression of converted breakpoints, where in a match double faults occur, and who benefits most from unforced errors. Further detail is available for each point in the game by clicking on the relevant segment, with the information displayed in the center of the visualiser.

At all levels of the application, the central momentum meter displays an overall swing of player success, calculated algorithmically from match data. If a player is particularly on top of their game, dropping less unforced errors, holding their service games etc, the momentum meter will display a larger portion of their colour in the central circular graph. This acts as a quick indicator of how the match is progressing for the players.

As matches are completed, they are added to the Pointstream database and can be re-visited at any time. The data view for a completed match retains all information that is available in the live data view, although obviously the outcome is already known! A completed visualisation is unique to the match it represents, and goes some way to demonstrate how data can be at the same time both interesting and informative to look at.
The application will be producing live data all through the US Open up to the finals on the 12th of September, so if you are following the tournament, be sure to check it out!